01 / Physical world
Power is measured.
At the rack, the meter records actual power. But it cannot tell which customer was using the server.


GreenShift connects real power measurements with workload activity to reveal how energy is distributed across shared cloud infrastructure — from physical hosts to virtual machines and applications.
Power meters know how much electricity a server draws. Infrastructure software knows which workloads are running. Neither, on its own, reveals the energy attributable to each workload.
At the rack, the meter records actual power. But it cannot tell which customer was using the server.
Virtualization and Kubernetes environments identify active machines, services and applications — but that is not a physical power reading.
GreenShift brings measured energy and workload activity together to attribute consumption to the workloads that use it.
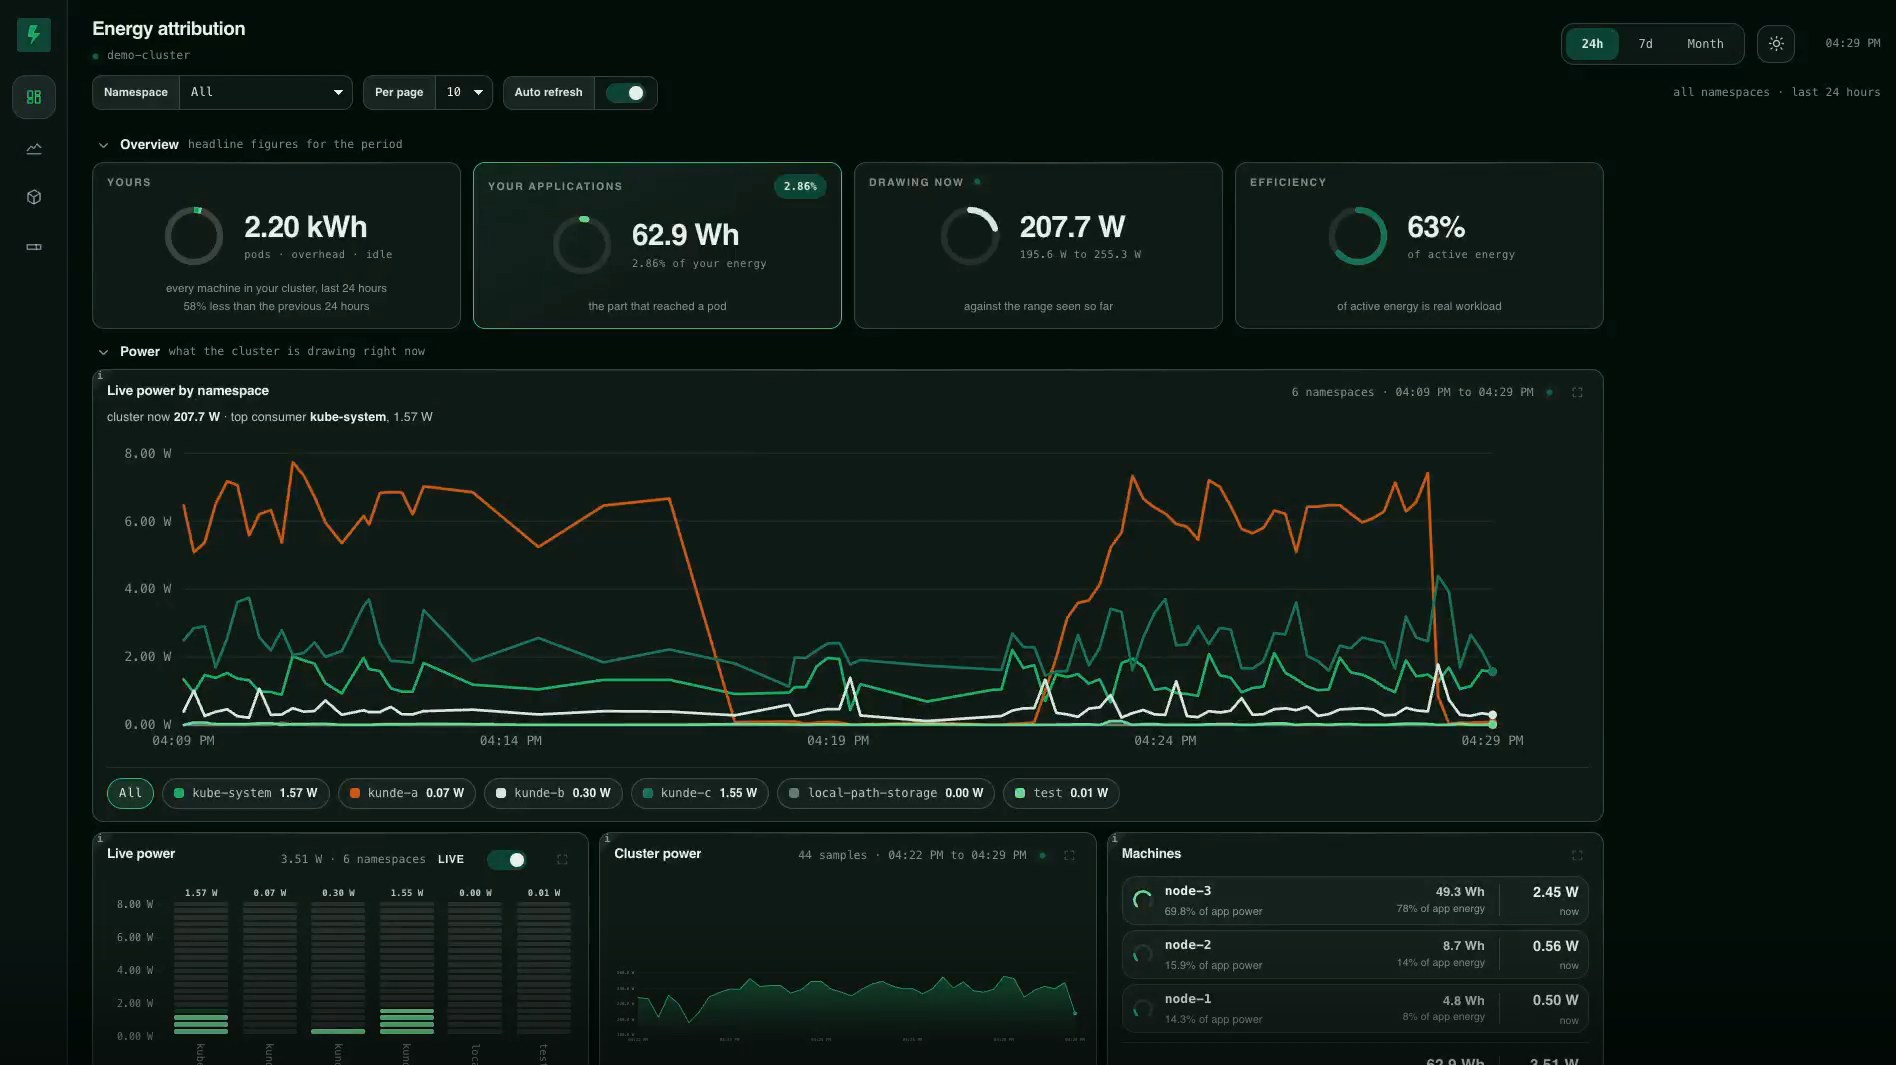
Explore the actual GreenShift dashboard. The screenshots come from an implementation that connects physical PDU measurements to workload attribution.
GreenShift reads physical power through the PDU. The dashboard displays the measured consumption and the current power draw.
Energy attribution is not just another chart. It gives infrastructure operators the evidence to understand customer consumption, plan resources and respond to customers asking for energy data.
See the energy behind different customer workloads — and use those insights to inform pricing and profitability analysis.
Understand when different workloads draw power, how peaks overlap and where capacity decisions deserve a closer look.
Use attributed energy as the measurement-based foundation for customer-level energy information, CO₂ calculations and reporting.
It's a simple idea with a carefully designed measurement chain: use the real power reading as the reference, then assign shares based on recorded workload activity.
Example power drawn by a physical server.
Example share associated with one customer workload.
An attributable portion of the measured total.
GreenShift is built around a specific challenge: multiple workloads sharing physical hardware. We focus on supported environments where the measurement chain can be made complete.
Understand the energy attributable to different customers in shared, virtualized environments.
Extend physical energy measurement with visibility into the virtualized workloads delivered to customers.
Explore the same attribution approach for internal services and applications — subject to infrastructure compatibility.
Developed through the EMULATE research environment at Fachhochschule Dortmund, GreenShift is already operational in selected compatible setups. The product story is anchored in a working measurement-to-attribution chain — not just a roadmap.
GreenShift grew out of the EMULATE research project at Fachhochschule Dortmund. Our team combines infrastructure engineering, measurement technology and experience bringing research into business.
Business model, funding & market entry
Dan leads GreenShift's business development, financing and go-to-market strategy. At Fachhochschule Dortmund, he turns research into viable ventures. Previously, he helped lead an €800,000 seed round for an AI startup and earned a Master's in Entrepreneurship from Trinity College Dublin.
Systems architecture & energy attribution
Jaime designed GreenShift's technical concept. As Lead Systems Architect at Fachhochschule Dortmund, he coordinates cloud, edge and embedded engineering for the university's role in IPCEI-CIS. His background includes KubeCon speaking, five registered hardware patents and a Samsung 5G Challenge win.
Platform & billing architecture
PhD-qualified software developer with 20+ years of experience, including eleven in distributed systems and seven building telecom billing platforms at Qvantel.
Software development
Builds GreenShift's measurement core. His background includes low-latency trading systems and graduate studies in wireless and embedded systems.
Development & test infrastructure
Develops the environment used to validate the GreenShift measurement chain. Brings IT operations experience and studies Digital Transformation at Fachhochschule Dortmund.
Data processing & reporting
Works on data processing and reporting, with more than eight years of software and data architecture experience across multiple industries.
Scientific advisor
Leads the EMULATE research project that gave rise to GreenShift and supports the team in a scientific advisory capacity, without an operational role.
Find out whether your shared infrastructure can benefit from measured, workload-level energy attribution. We can discuss your environment and the requirements for a pilot.
Your message is addressed directly to dan.stoschek@fh-dortmund.de.